Introduction
The purpose of this
site is to create interactive models that can help illustrate some of the
concepts and methods of elementary mathematics. The germ of the idea for me goes back to a cross-country
road trip I took with my family in 1956 when I was eight years old. Between stops there were seemingly interminable
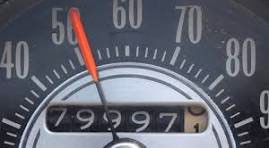
periods of boredom. During these periods, I found myself watching the
dashboard, specifically the odometer and speedometer, of the car, calculating
how much progress we were making
toward our next stop and estimating when we would get there.
The odometer
in those days consisted of a set of wheels
marked in units of one-tenth of a mile. A unit of the next represented a single mile of
progress, the units of the next represented 10 miles of progress, and so on. As
each wheel advances at 10 times the rate of the one to
its left, so that after a complete revolution of the one (i.e., by 10 units), the other will advance by one unit, and vice versa. The odometer is thus a
visual model of the decimal numeration system, with each wheel corresponding to the place value
for a specific power of 10. In those
days, since no one imagined cars lasting for more than 100,000 miles, the
odometer only had six components, so that the left-most one corresponded to
units of 10,000. But, of course, it is easy to imagine having
arbitrarily more wheels on the left to represent larger and larger whole numbers. More interestingly, it is also easy to
imagine adding wheels to the right, even extending forever, making it possible
to represent tinier and tinier distances. It is also
able to observe the change in the odometer readings over fractional distances, like a 1/2 or 1/4 of a mile, illustrating the decimal
representation of fractions. The concept of "carrying" is naturally
illustrated by watching one or (especially) more of the readings "turn
over."
The odometer
also illustrates the concepts of operators and
composition. Each of the wheels in the odometer is a kind of operator which accepts input in the form
of rotation and, except for the last, in addition to a display, produces output
in the form of a modified rotation. The odometer itself
is constructed as a composition of these
operators in which the output of each operator is connected as input
to the next. For the internal wheels,
the effect of the operator is that of the fraction one-tenth, which reduces the input by a factor
of 10. The result of composing
the operators is to successively reduce the original input to one-tenth, one-hundredth, one-thousandth, and so
on, thus providing a visual representation of fractional multiplication.
Other topics
which can usefully
be visualized in this model include alternative bases (e.g.,
suppose our wheels use octal units) and the relationship of speed, time, and
distance. Now, we can't subject students to endless hours of sitting in a car
watching an actual odometer. So, to make useful models,
we need to simplify the models and make the point of the
models more explicit without eliminating the element of discovery. So, our hope
is to carry this out for all kinds of visual interactive models and all kinds of topics.
Please send
questions, comments, bug reports and suggestions for additional topics or
improvements to the existing models to: dave.posner@elementary-math.com